1
2
3
4
5
6
7
8
9
10
11
12
13
14
15
16
17
18
19
20
21
22
23
24
25
26
27
28
29
30
31
32
33
34
35
36
37
38
39
40
41
42
43
44
45
46
47
48
49
50
51
52
53
54
55
56
57
58
59
60
61
62
63
64
65
66
67
68
69
70
71
72
73
74
75
| import tensorflow as tf
from tensorflow.keras import datasets, layers, models, regularizers
from tensorflow.keras.preprocessing.image import ImageDataGenerator
from tensorflow.keras.callbacks import EarlyStopping
import matplotlib.pyplot as plt
(train_images, train_labels), (test_images, test_labels) = datasets.mnist.load_data()
train_images = train_images.reshape((60000, 28, 28, 1)).astype('float32') / 255
test_images = test_images.reshape((10000, 28, 28, 1)).astype('float32') / 255
datagen = ImageDataGenerator(
rotation_range=10,
zoom_range=0.1,
width_shift_range=0.1,
height_shift_range=0.1,
validation_split=0.2 # 在這裡指定驗證集的比例
)
train_generator = datagen.flow(train_images, train_labels, batch_size=32, subset='training')
validation_generator = datagen.flow(train_images, train_labels, batch_size=32, subset='validation')
model = models.Sequential()
model.add(layers.Conv2D(32, (3, 3), activation='relu', input_shape=(28, 28, 1), kernel_regularizer=regularizers.l2(0.001)))
model.add(layers.MaxPooling2D((2, 2)))
model.add(layers.Conv2D(64, (3, 3), activation='relu', kernel_regularizer=regularizers.l2(0.001)))
model.add(layers.MaxPooling2D((2, 2)))
model.add(layers.Conv2D(64, (3, 3), activation='relu', kernel_regularizer=regularizers.l2(0.001)))
model.add(layers.Flatten())
model.add(layers.Dense(64, activation='relu'))
model.add(layers.Dropout(0.5))
model.add(layers.Dense(10))
model.summary()
model.compile(optimizer='adam',
loss=tf.keras.losses.SparseCategoricalCrossentropy(from_logits=True),
metrics=['accuracy'])
early_stopping = EarlyStopping(monitor='val_loss', patience=3)
history = model.fit(train_generator, epochs=50, validation_data=validation_generator, callbacks=[early_stopping])
test_loss, test_acc = model.evaluate(test_images, test_labels, verbose=2)
print(f"Test accuracy: {test_acc}")
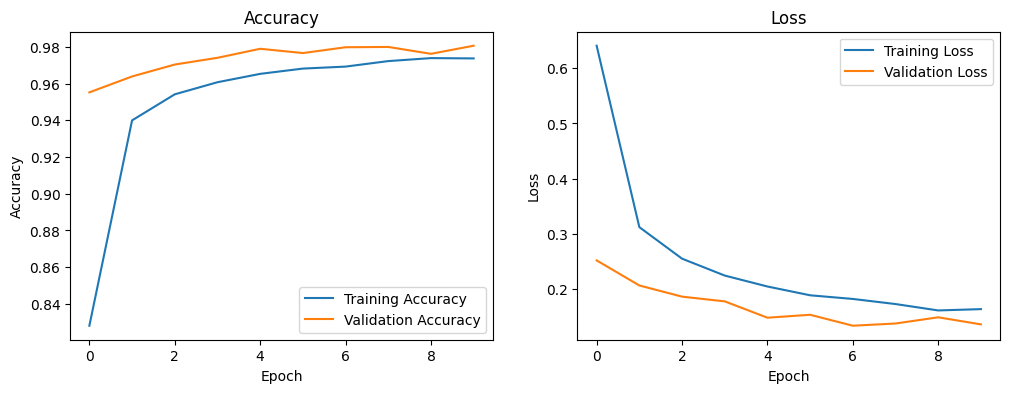
plt.figure(figsize=(12, 4))
plt.subplot(1, 2, 1)
plt.plot(history.history['accuracy'], label='Training Accuracy')
plt.plot(history.history['val_accuracy'], label='Validation Accuracy')
plt.xlabel('Epoch')
plt.ylabel('Accuracy')
plt.legend()
plt.title('Accuracy')
plt.subplot(1, 2, 2)
plt.plot(history.history['loss'], label='Training Loss')
plt.plot(history.history['val_loss'], label='Validation Loss')
plt.xlabel('Epoch')
plt.ylabel('Loss')
plt.legend()
plt.title('Loss')
plt.show()
|