1
2
3
4
5
6
7
8
9
10
11
12
13
14
15
16
17
18
19
20
21
22
23
24
25
26
27
28
29
30
31
32
33
34
35
36
37
38
39
40
41
42
43
44
45
46
47
48
49
50
51
52
53
54
55
56
57
58
59
60
61
62
63
64
65
66
67
68
69
70
71
72
73
74
75
76
77
78
79
|
import matplotlib.pyplot as plt
import matplotlib.patches as patches
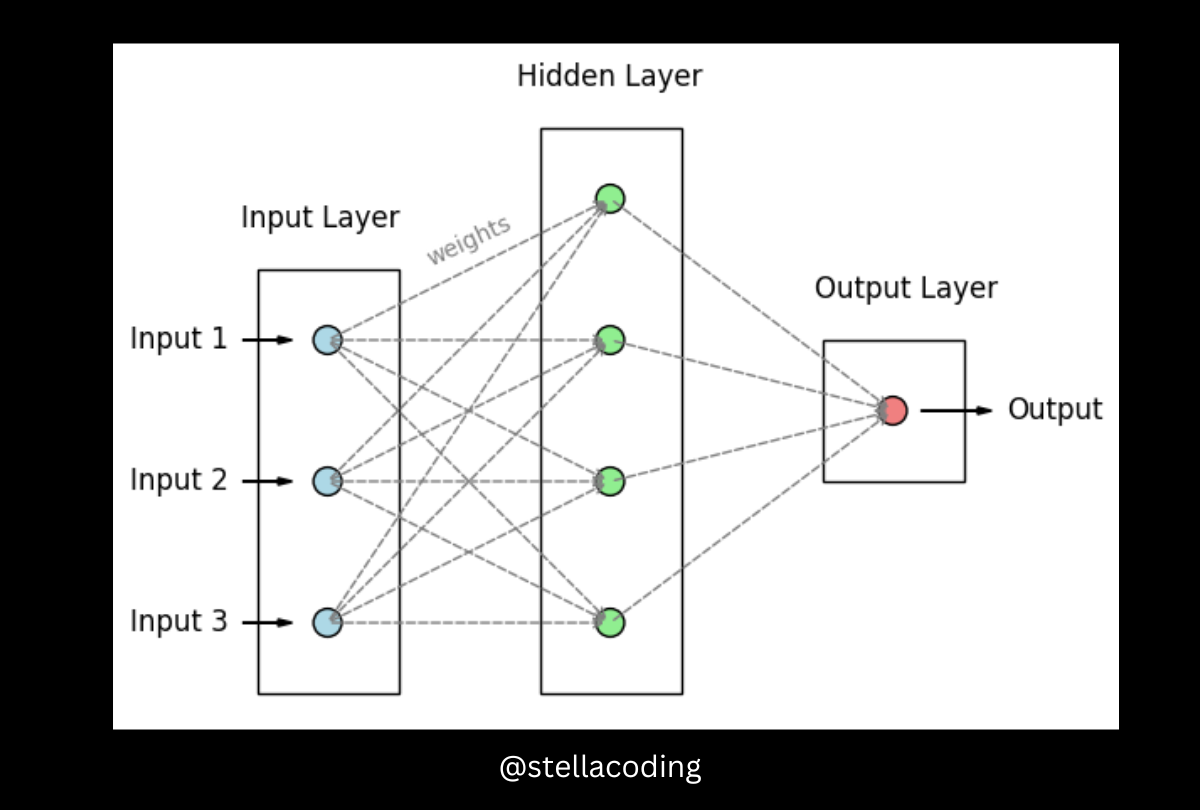
input_nodes = ['Input 1', 'Input 2', 'Input 3']
hidden_nodes = ['Hidden 1', 'Hidden 2', 'Hidden 3', 'Hidden 4']
output_nodes = ['Output']
pos = {
    'Input 1': (0, 3),
    'Input 2': (0, 2),
    'Input 3': (0, 1),
    'Hidden 1': (2, 4),
    'Hidden 2': (2, 3),
    'Hidden 3': (2, 2),
    'Hidden 4': (2, 1),
    'Output': (4, 2.5)
}
fig, ax = plt.subplots(figsize=(10, 6))
for node in input_nodes:
    ax.add_patch(plt.Circle(pos[node], 0.1, color='lightblue', ec='black', zorder=3))
    plt.text(pos[node][0] - 0.7, pos[node][1], node, fontsize=12, ha='right', va='center')
    ax.arrow(pos[node][0] - 0.6, pos[node][1], 0.35, 0, head_width=0.05, head_length=0.1, fc='black', ec='black', length_includes_head=True)
for node in hidden_nodes:
    ax.add_patch(plt.Circle(pos[node], 0.1, color='lightgreen', ec='black', zorder=3))
for node in output_nodes:
    ax.add_patch(plt.Circle(pos[node], 0.1, color='lightcoral', ec='black', zorder=3))
    plt.text(pos[node][0] + 0.8, pos[node][1], 'Output', fontsize=12, ha='left', va='center')
    ax.arrow(pos[node][0] + 0.2, pos[node][1], 0.5, 0, head_width=0.05, head_length=0.1, fc='black', ec='black', length_includes_head=True)
for input_node in input_nodes:
    for hidden_node in hidden_nodes:
        ax.annotate("", xy=(pos[hidden_node][0], pos[hidden_node][1]), xytext=(pos[input_node][0], pos[input_node][1]),
                    arrowprops=dict(arrowstyle="->", linestyle="--", color='gray'))
plt.text(1, 3.7, 'weights', fontsize=10, color="gray", ha='center', va='center', rotation=25)
for hidden_node in hidden_nodes:
    for output_node in output_nodes:
        ax.annotate("", xy=(pos[output_node][0], pos[output_node][1]), xytext=(pos[hidden_node][0], pos[hidden_node][1]),
                    arrowprops=dict(arrowstyle="->", linestyle="--", color='gray'))
input_rect = patches.Rectangle((-0.5, 0.5), 1, 3, linewidth=1, edgecolor='black', facecolor='none')
hidden_rect = patches.Rectangle((1.5, 0.5), 1, 4, linewidth=1, edgecolor='black', facecolor='none')
output_rect = patches.Rectangle((3.5, 2), 1, 1, linewidth=1, edgecolor='black', facecolor='none')

ax.add_patch(input_rect)
ax.add_patch(hidden_rect)
ax.add_patch(output_rect)

plt.text(-0.05, 3.8, 'Input Layer', fontsize=12, ha='center')
plt.text(2, 4.8, 'Hidden Layer', fontsize=12, ha='center')
plt.text(4.1, 3.3, 'Output Layer', fontsize=12, ha='center')
ax.set_xlim(-1, 5)
ax.set_ylim(0, 5.5)
ax.set_aspect('equal')
ax.axis('off')
plt.show()
|