什麼是張量(Tensor)?
無論是哪種類型的數據(如數值、文字、圖像、音頻),在進入機器學習模型之前,這些數據都會經過適當的預處理轉換成數值形式,然後進一步轉換成張量(Tensor)供模型使用。
張量(Tensor)為機器學習框架中處理和運算數據的基本單位。
- 張量為多維數組(multidimensional array),能夠靈活地表示不同類型和不同維度的數據,可以表示純量(0D張量)、向量(1D張量)、矩陣(2D張量)及更高維度的數據結構。
- 深度學習框架(如 TensorFlow 和 PyTorch)設計用來高效地處理張量。張量運算可以被分解成許多小的計算單元,這些單元可以在 GPU 上並行執行多個運算任務,加速計算過程。
這裡我將用房屋數據來舉例每種張量的概念,以幫助我們更好地理解張量的意思。(不然3d,4d用程式呈現是出現一堆矩陣我看起來跟2d都一樣暈啊)
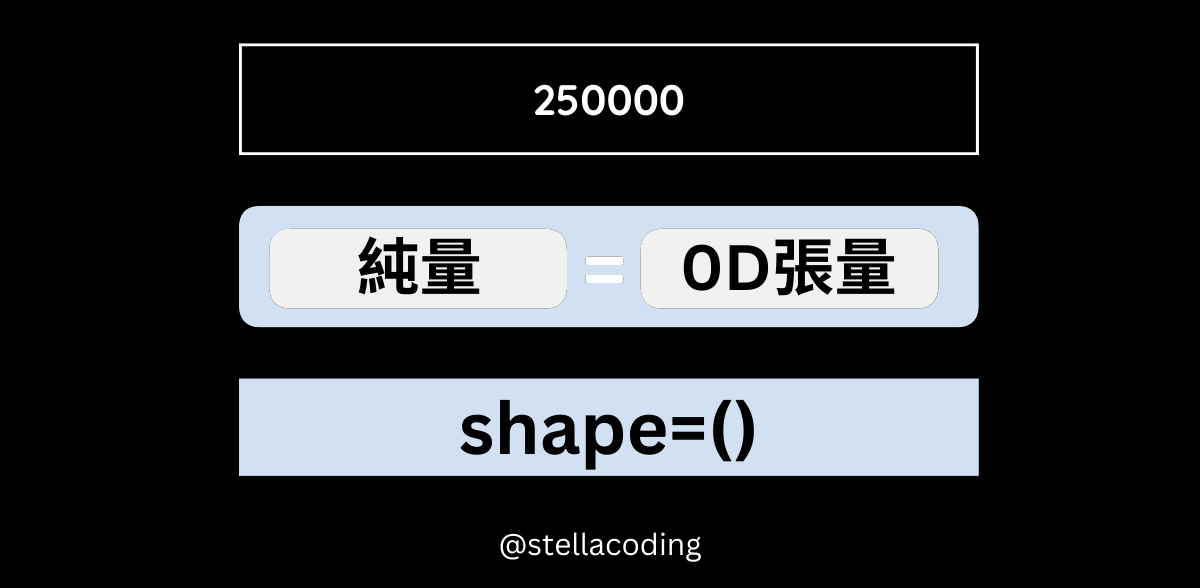
純量(Scalar)
- 0D 張量
- 0 維
- 0 軸(Axis)
- 單一數值
- 例如,一個房屋的價格(美元)
1 | import tensorflow as tf |
1 | tf.Tensor(250000, shape=(), dtype=int32) |
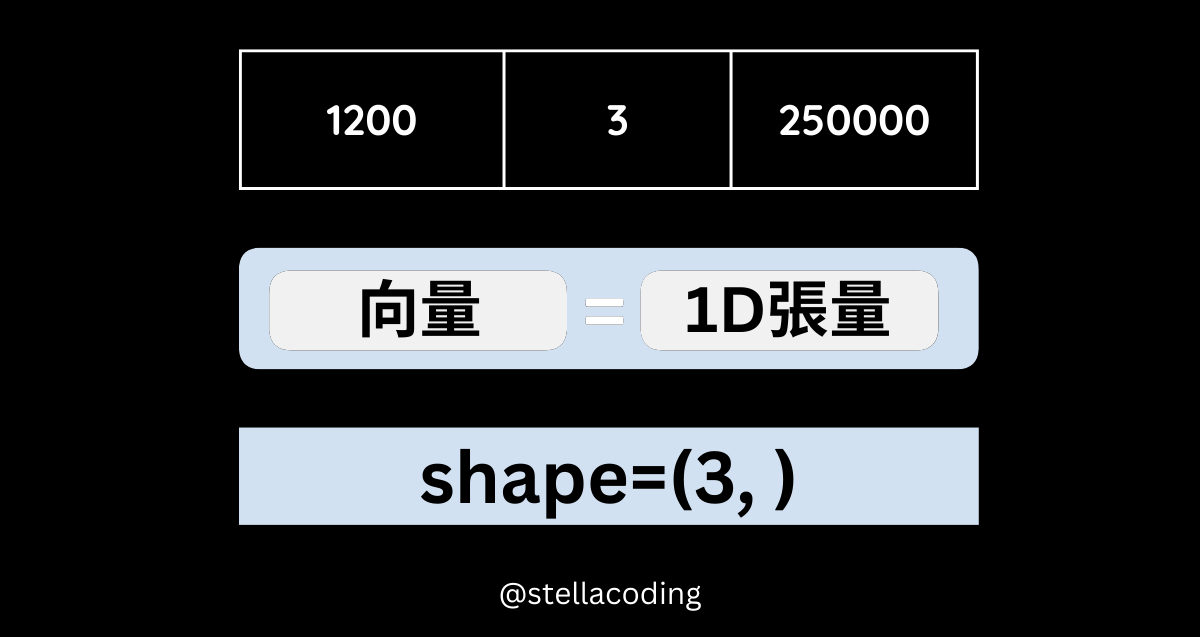
向量(Vector)
- 1D 張量
- 1 維陣列
- 1 軸
- 多個數值構成的 1 維陣列
- 例如,一個房屋的所有特徵,例如面積(平方英尺)、房間數、價格(美元)
1 | import tensorflow as tf |
1 | tf.Tensor([ 1200 3 250000], shape=(3,), dtype=int32) |
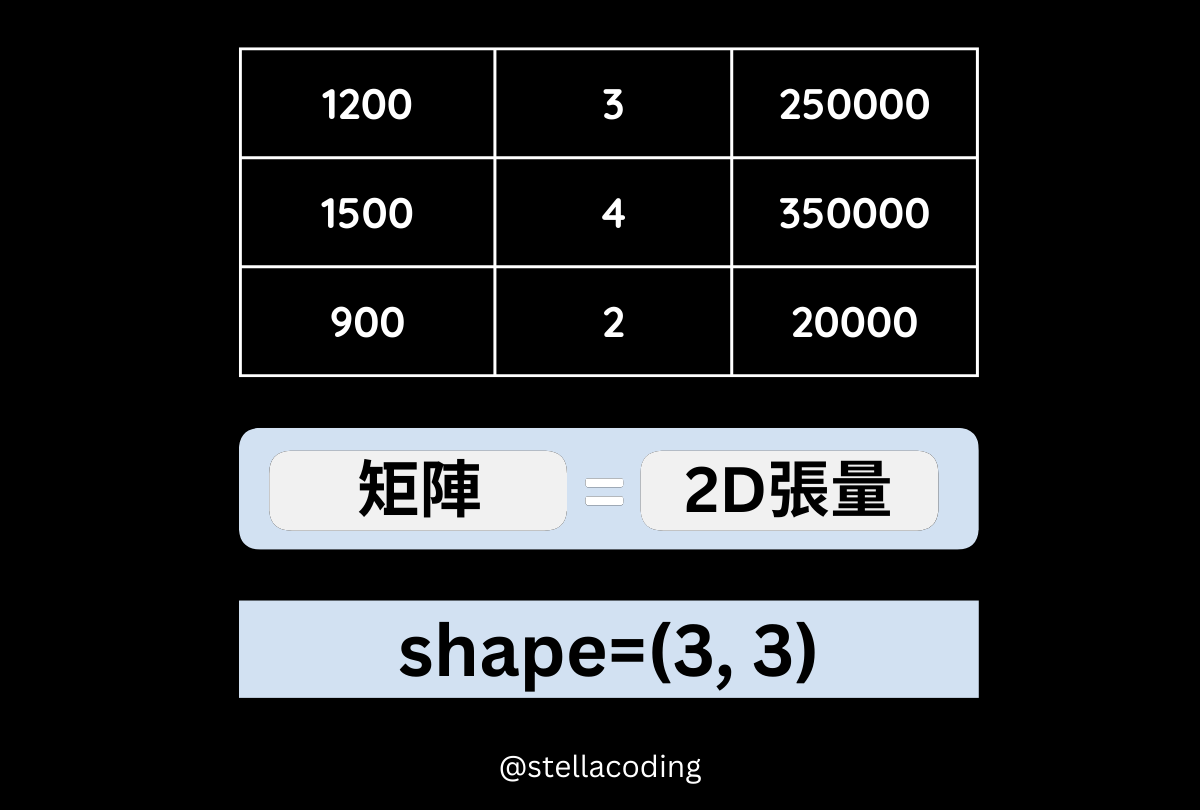
矩陣(Matrix)
- 2D 張量
- 2 維陣列
- 2 軸
- 多個向量構成的 2 維陣列
- 例如,房屋數據集的 3 個樣本,每個樣本有多個特徵
1 | import tensorflow as tf |
1 | tf.Tensor( |
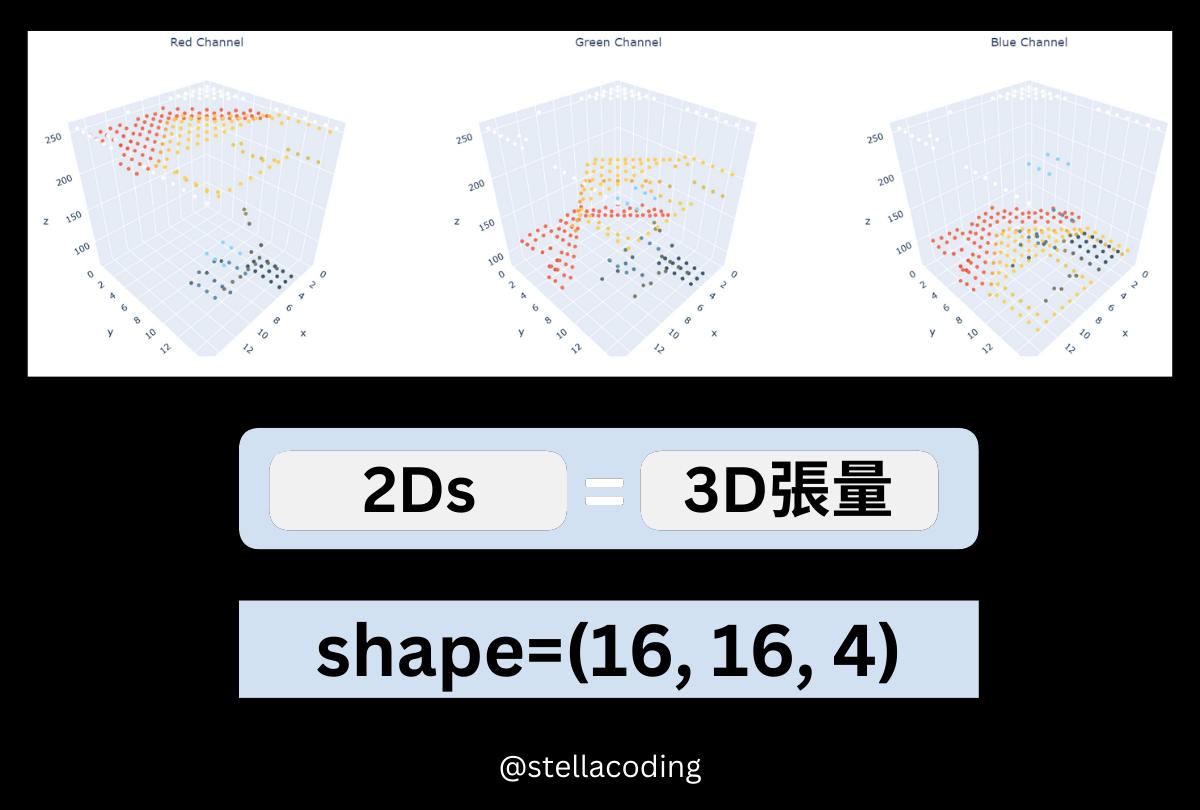
3D 張量(3D Tensor)
- 3D 張量
- 3 維陣列
- 3 軸
- 多個 2D 矩陣構成的陣列
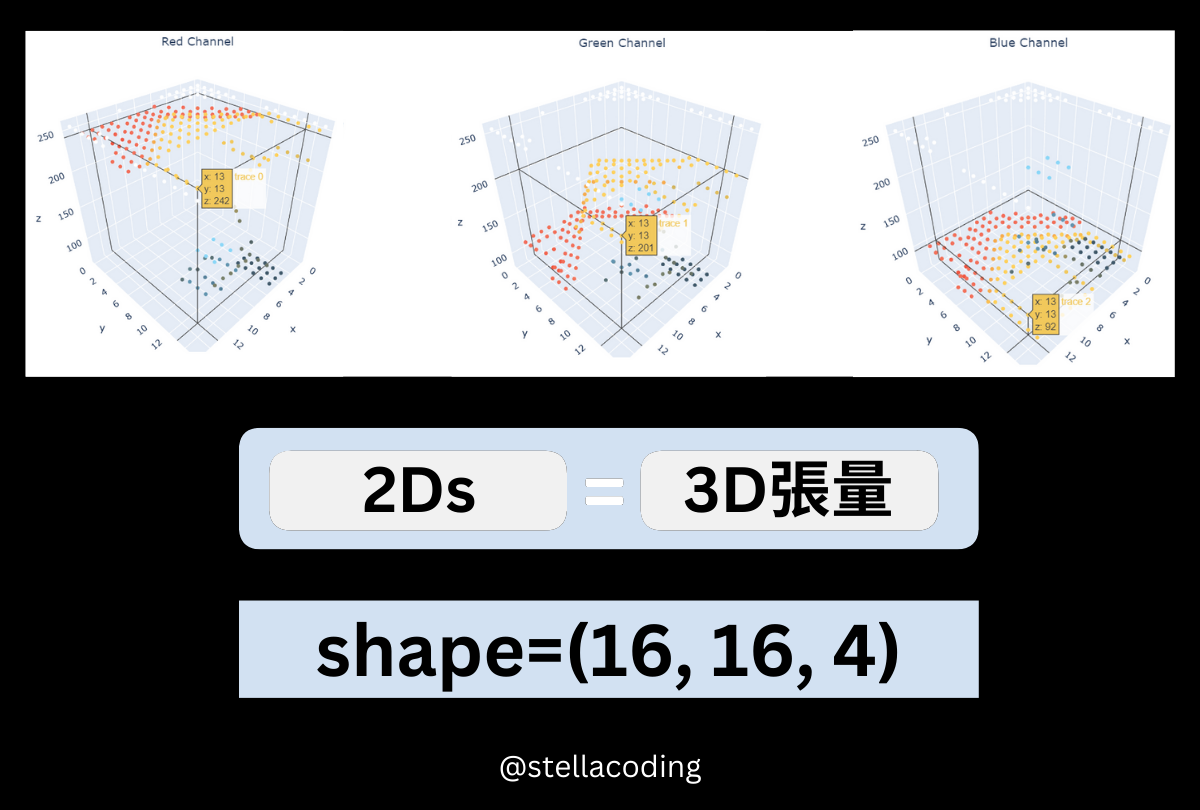
- 例如,一張 16x16 的彩色房屋圖片,每個像素點有 RGB 3個通道

圖片像素資訊
1 | from PIL import Image |
1 | 圖像的寬度:16 像素 |
圖形的形狀為 (16, 16, 4) 的 3D 張量。
16表示圖像的寬度和高度,即圖像是16x16像素。4表示圖像的通道數量,即紅色R、綠色G、藍色B 和 Alpha 通道A。- 每個通道都是一個 2D 矩陣:
- 每個 2D 矩陣的形狀為
(16, 16),表示特定顏色通道的像素值矩陣。 - 每個像素的顏色值由
4個通道值(RGBA)組成。
- 每個 2D 矩陣的形狀為
- 左上角 1x1 的像素RGB值:
- 左上角
(0, 0)像素的 RGB 值是[255, 255, 255, 0]。 - 即紅色、綠色和藍色通道的值都是
255。 - 第 4 個值
0是 Alpha 通道的值,表示透明度。0表示完全透明,255表示完全不透明。
- 左上角
圖片像素 3D 圖
1 | import numpy as np |
4D 張量(4D Tensor)
- 4D 張量
- 4 維陣列
- 4 軸
- 多個 3D 張量構成的陣列
- 例如,一個 11 幀的房屋影片,每幀為一張 3D 彩色圖片
1 | import cv2 |
1 | 影片的幀數:11 |
影片的形狀為 (11, 1080, 1920, 3) 的 4D 張量。
11表示影片的幀數(frames)。1080表示每幀圖像的高度(像素)。1920表示每幀圖像的寬度(像素)。3表示圖像的通道數量,即紅色R、綠色G、藍色B。- 每幀圖像都是一個 3D 張量。
- 每個 3D 張量的形狀為
(1080, 1920, 3),表示圖像的高度、寬度和顏色通道。 - 每個 2D 張量的形狀為
(1080, 1920),表示特定顏色通道的像素值矩陣。 - 每個像素的顏色值由
3個通道值(RGB)組成。
- 每個 3D 張量的形狀為
常見 QA
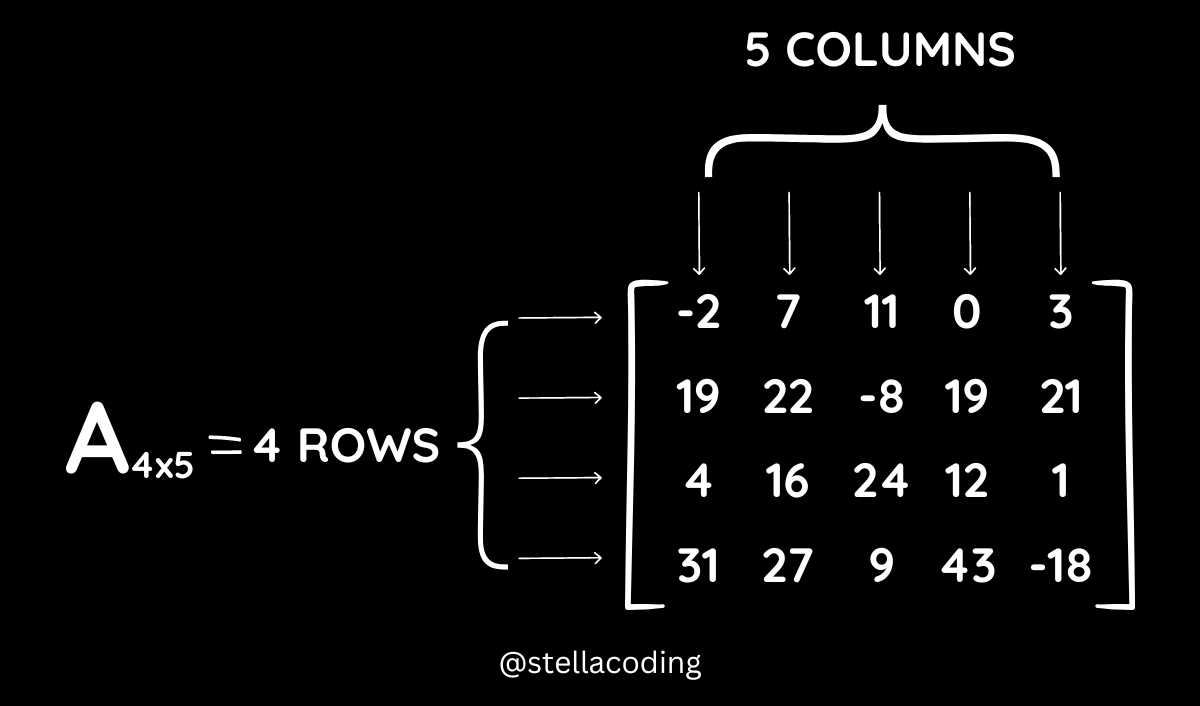
矩陣行列怎麼區分?
- 在台灣,橫向稱為列,縱向稱為行(欄)。
- 在大陸,橫向稱為行,縱向稱為列。
(超過負荷已登出)
我個人是記 row(列) 跟 column(欄),不然中文容易會被搞亂。
- Row:「Row」裡有「o」,就像一個橫著的圓圈(橫向)。
- Column: 「Column」裡有「l」,就像一根直線(縱向)。
(資料來源:
What is Order of Matrix?)
那如何寫成矩陣呢?先看 Row,再看 Col。有 4 Row,而每一個 Row 裡有 5 個值(Col)。
1 | np.array([ |
3維向量跟3D張量怎麼區分?
1 | import numpy as np |
1 | 張量的形狀: (3,) |
1 | import numpy as np |
1 | 張量的形狀: (3, 2, 2) |
TensorFlow和NumPy產生張量不同點?
| 特點 | TensorFlow | NumPy |
|---|---|---|
| 適用場景 | 機器學習模型構建、訓練和推理 | 科學計算、數據分析、矩陣運算 |
| 支援 GPU 加速 | 是 | 否 |
| 產生張量 | tf.constant |
np.array |
結論
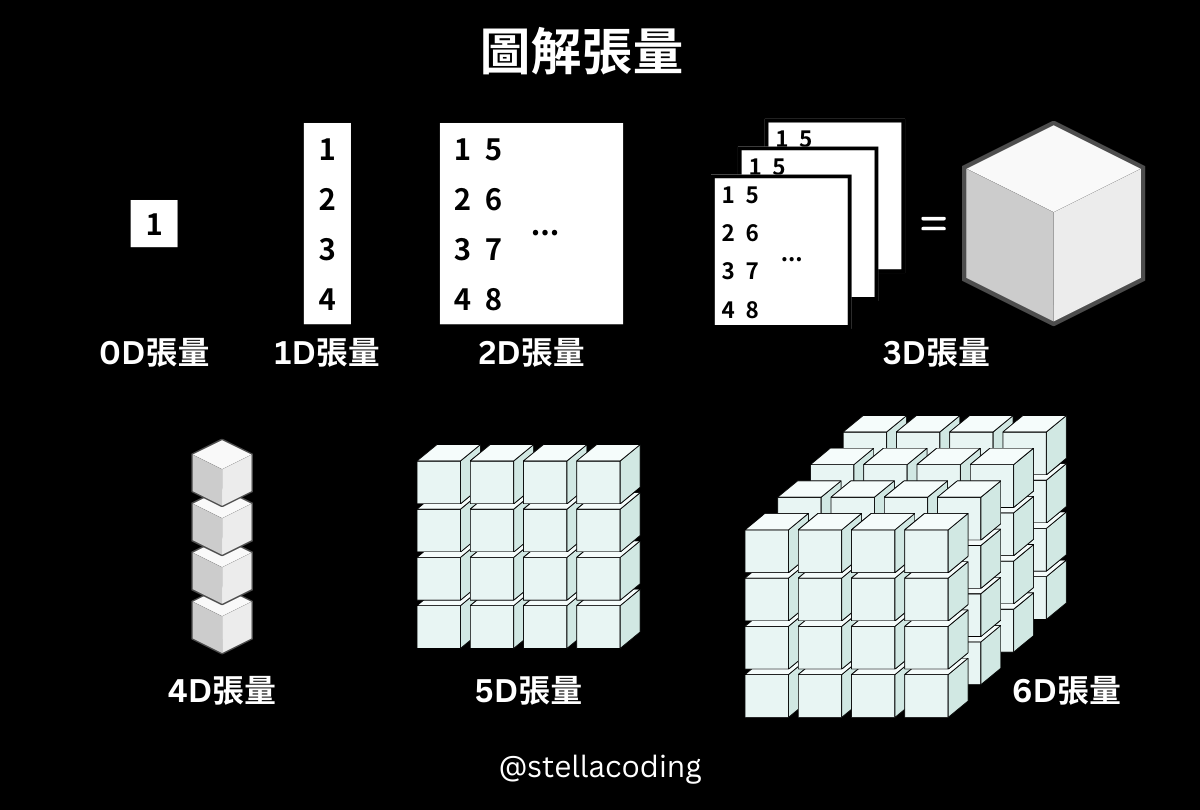
- 0D 張量(純量): 一個單一的數值,例如
1。 - 1D 張量(向量): 一維陣列,例如
[1, 2, 3, 4]。 - 2D 張量(矩陣): 二維陣列,例如
[[1, 5], [2, 6], [3, 7], [4, 8]]。 - 3D 張量: 三維陣列,由多個矩陣組成,例如
[[[1, 5], [2, 6], [3, 7], [4, 8]], ...]。 - 4D 張量: 四維陣列,由多個 3D 張量組成,例如
(11, 1080, 1920, 3)。 - 5D 張量: 五維陣列,由多個 4D 張量組成,用於表示更高維度的數據結構。